
# Smart heatmap
Generate heatmaps from events (e.g. tweets, disease cases, crimes) that reflect the number of events per person
# Rationale
Mapping the spatial distribution of disease risk is an important component of epidemic control, allowing interventions and planning to be more optimally targeted.
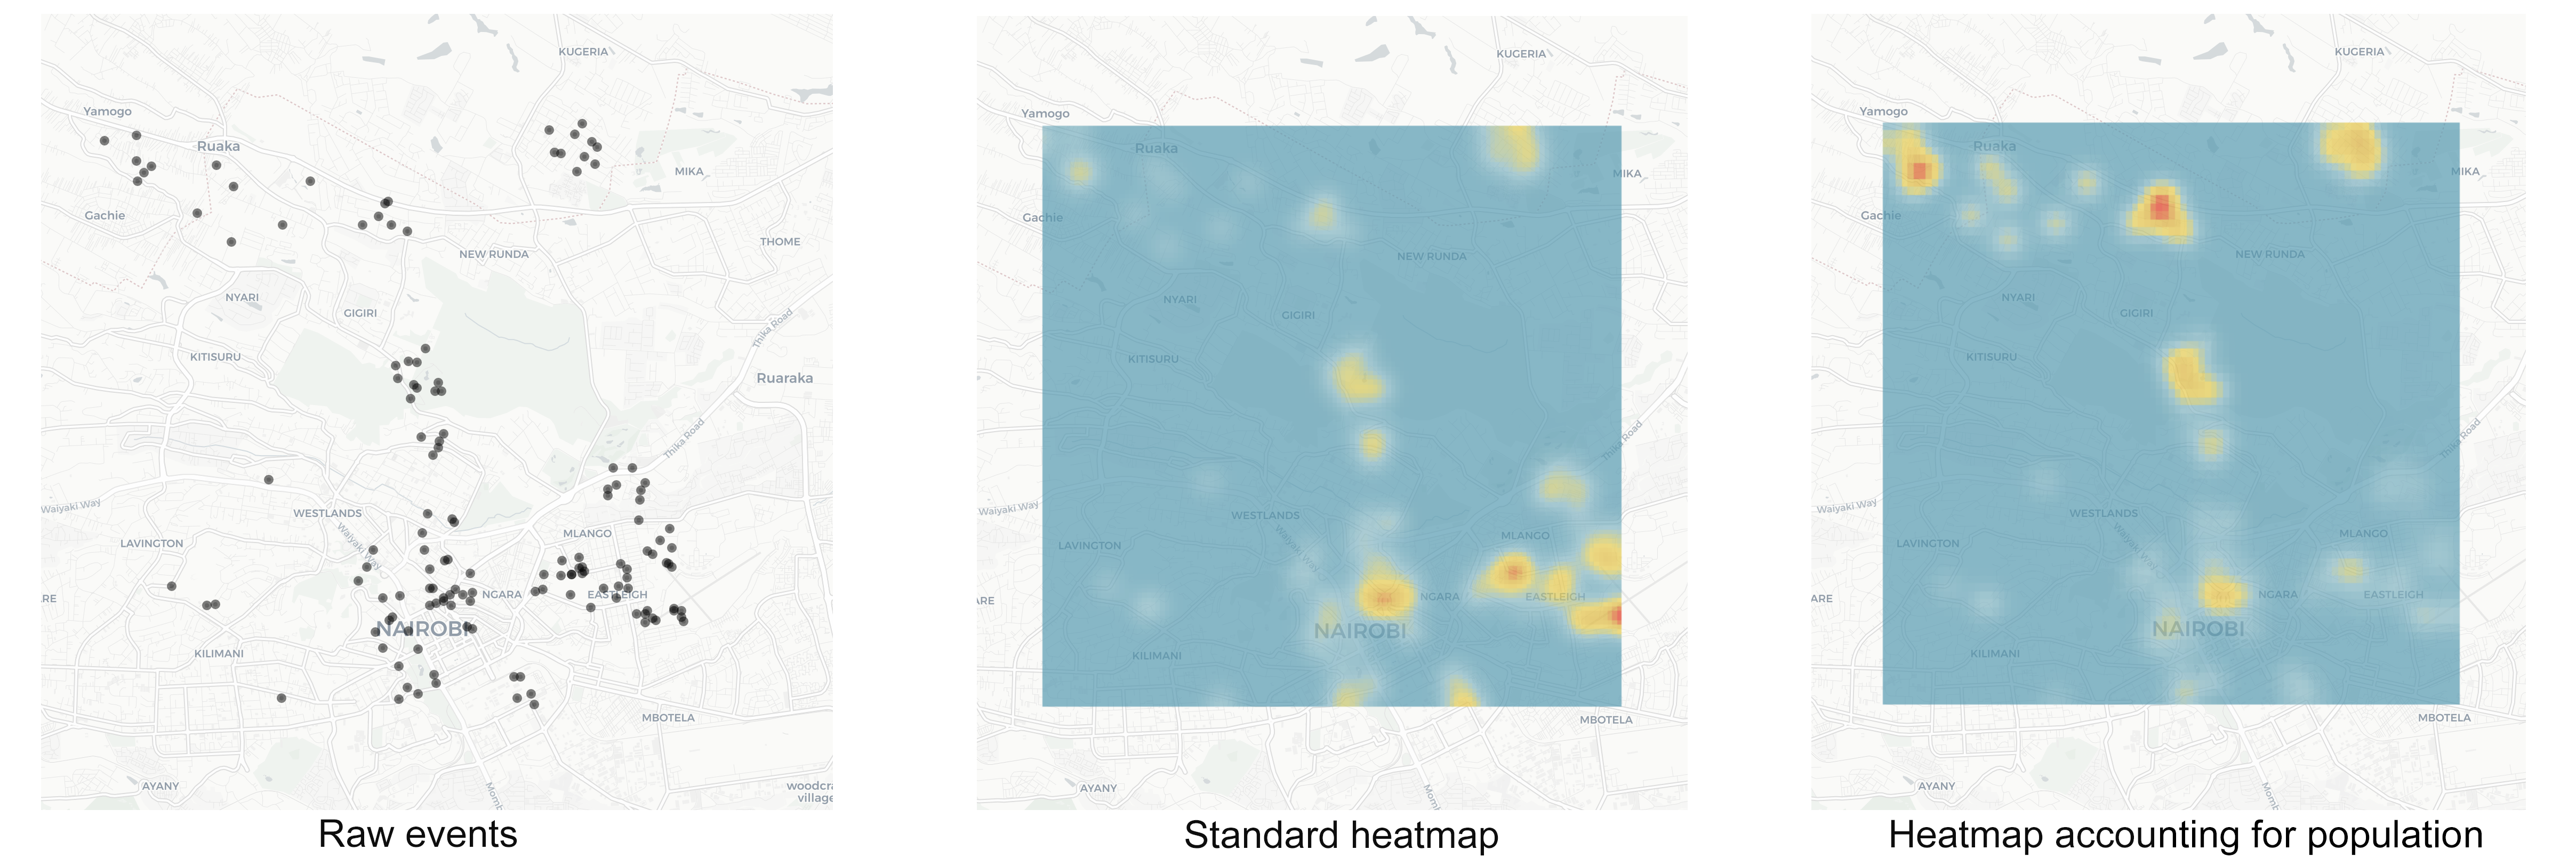
While it is possible to map cases by their address (left), and generate ‘heat maps’ showing density of cases (middle), without accounting for the distribution and age structure of the underlying population, these maps are of limited value and can be misleading if used to understand transmission risk. Recording 100 cases in a city of 1m people is a different situation to 100 cases in a city of 1000.
# Our approach
This algorithm automates the generation of risk maps (expected incidence) from georeferenced (or with address) case data using gridded population data (right). In turn, this provides programs with better estimates of where transmission is occurring as well as raw case counts.
# Implementations
This algorithm was originally developed to help map malaria risk from individual case data in southern Africa. We have since applied it to map risk of gun violence in the USA and it is now being used to support our work on COVID-19 Risk Mapping
Think this sounds useful?
You can reach us at hello@locational.io to ask any questions, request additions or changes, or arrange a demo. We are actively developing these algorithms and would like to hear from you.