
# Spatial prediction
Predicting outcomes across a region from point level data
# Rationale
Surveys are widely used to gather data on outcomes across space. These include measurements from sensors, prevalence of infection among a population, or coverage of health interventions such as vaccines. Surveys are, however, expensive and as such are typically only conducted on a sample of the population or area in question. This leaves gaps in our understanding of these outcomes across the surveyed area. To fill in the gaps requires spatial modeling which can be challenging and expensive to perform.
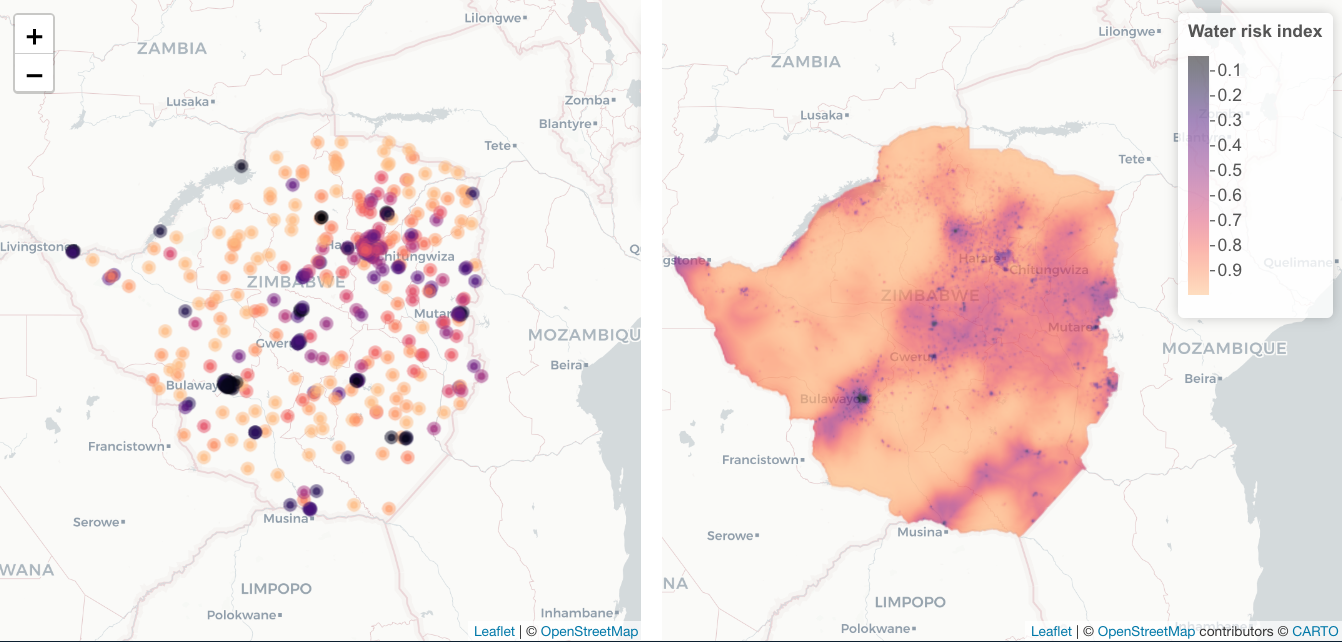 Example of using spatial prediction to create maps of access to water in Zimbabwe
# Our approach
We have developed algorithms to automate the generation of predictive maps from survey data, simplifying access to these approaches. The algorithm can handle data from a single time point, as well as multiple time points, and can use predictors such as gridded environmental or climatological variables. Predictors can be supplied by users, but we also have pre-processed layers for every country that include information on distance to roads and rivers, average precipitation and temperature, seasonality of precipitation and temperature and population density. We use a Geoadditive modeling framework, which allows the algorithm to find non-linear associations with predictors and allows for the inclusion of a spatial (or spatio-temporal) effect which enables the algorithm to borrow strength across space and time. Once the algorithm has been fit, it can be used to predict the probability of the outcome across a grid, using the values of the predictors in that grid cell and the grid cell's location in space and time. As well as making a best guess of the outcome in a given location, the algorithm generates a range of possible values. Where the algorithm is more uncertain about the prediction, this range of values will be larger. Where it is more certain, the range will be smaller. This range of values can be used to quantify the uncertainty of the predictions, but also quantify how likely the outcome is greater or less than a user supplied threshold. For example, a disease program might be interested in predicting the probability that coverage of a vaccine is >80%. As well as making predictions across a grid, it is also possible to predict at specific user-defined points or over polygons.
In addition to making predictions, it is possible to use the algorithm to obtain the optimal locations for further surveys where the goal is to improve the predictions further. See here (opens new window) for further details of this so-called adaptive sampling where the goal is to improve predictions of hotspot locations.
# Implementations
This approach has been used to map hotspots of lymphatic filariasis (LF) in Samoa and will be used in a similar way as part of upcoming LF mapping exercises in Mali and Tanzania. This approach is also being used to help map vaccine coverage as well as mapping COVID-19 symptoms across the USA and risk of severe COVID-19 in Zimbabwe.
Think this sounds useful?
You can reach us at hello@locational.io to ask any questions, request additions or changes, or arrange a demo. We are actively developing these algorithms and would like to hear from you.