
# Risk mapping
Generating risk maps from georeferenced case data.
# Rationale
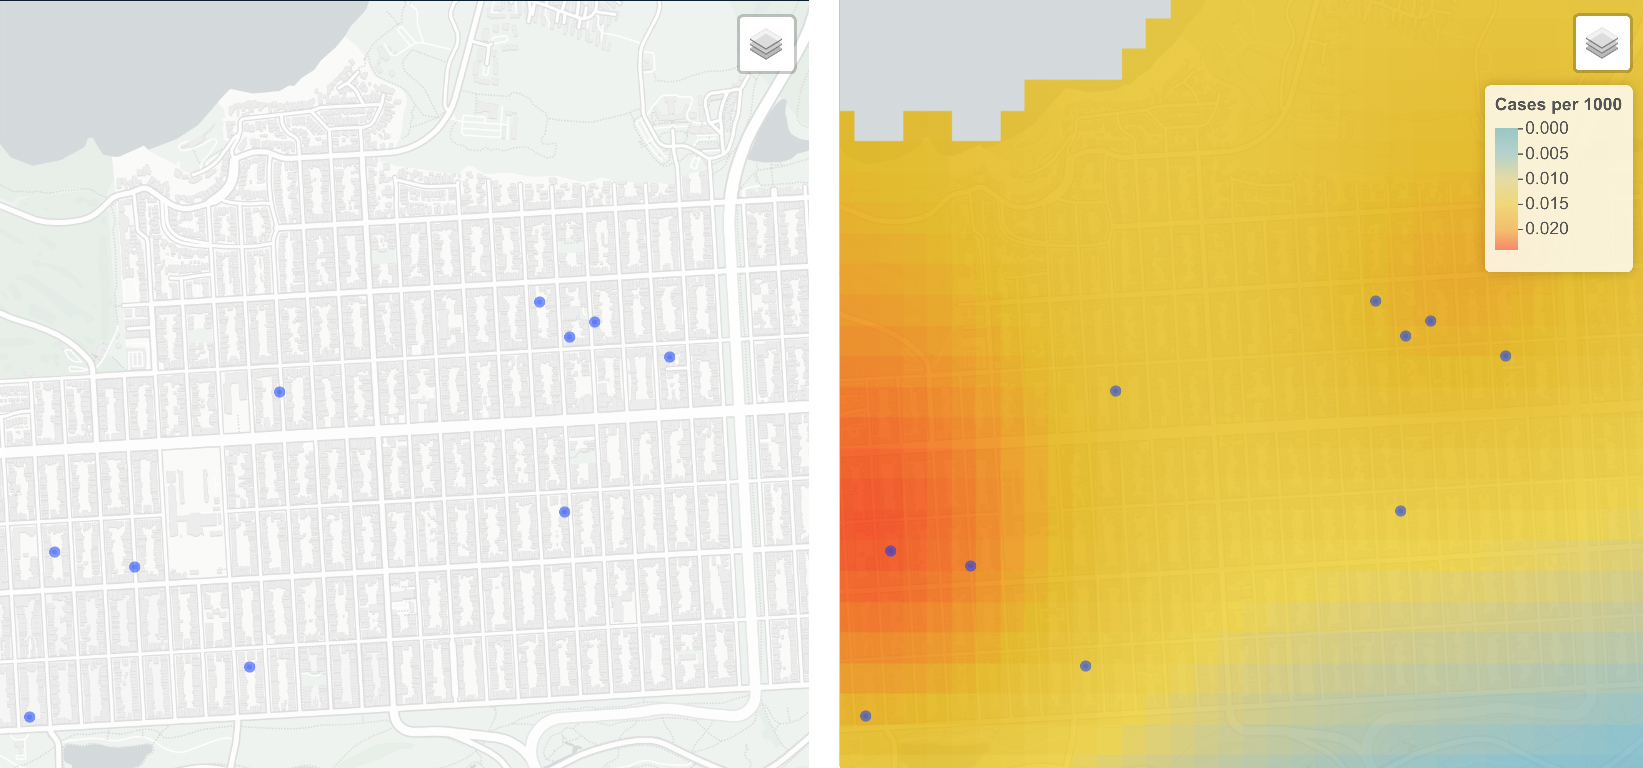
Mapping the spatial distribution of disease risk is an important component of epidemic control, allowing interventions and planning to be more optimally targeted. While it is possible to map cases by their address, and generate ‘heat maps’ showing density of cases, without accounting for the distribution and age structure of the underlying population, these maps are of limited value and can be misleading if used to understand transmission risk. 100 cases in a city of 1m people is a different situation to 100 cases in a city of 1000. Generating risk maps from raw case data requires the use of spatial modeling.
# Our approach
By looking at where cases are occuring, relative to the underlying population, we use our smart heatmap algorithm to characterize which factors - such as age structure of the underlying population, weather and poverty - lead to a higher likelihood of an individual being a case. This can then be used to predict risk based on these risk factors across a region of interest.
# Minimum required input
Set of coordinates of case locations
lat | lng |
|---|---|
| 1.1 | 1.1 |
| 1.2 | 1.2 |
| ... | ... |
# Implementations
We are working with Public Health Departments in the USA to help map covid-19 risk hotspots.
Think this sounds useful?
You can reach us at hello@locational.io to ask any questions, request additions or changes, or arrange a demo. We are actively developing these algorithms and would like to hear from you.