
# Symptom mapping
Predicting and mapping the prevalence of COVID-19 related symptoms from individual responses.
# Rationale
Understanding patterns of COVID-19 related symptoms among a population can provide valuable clues as to where transmission is occurring, where to target resources and whether interventions such as social distancing are working. An advantage of using symptoms over cases or deaths, is that upticks in symptoms among a population typically occur before upticks in hospital admissions. This gives public health experts an early warning of potential outbreaks.
Typically data on symptoms are not available on everyone, leaving some parts of the country or year without data. To provide a more complete picture across space and time, and to quantify the effects of public health policies, requires geospatial modeling.
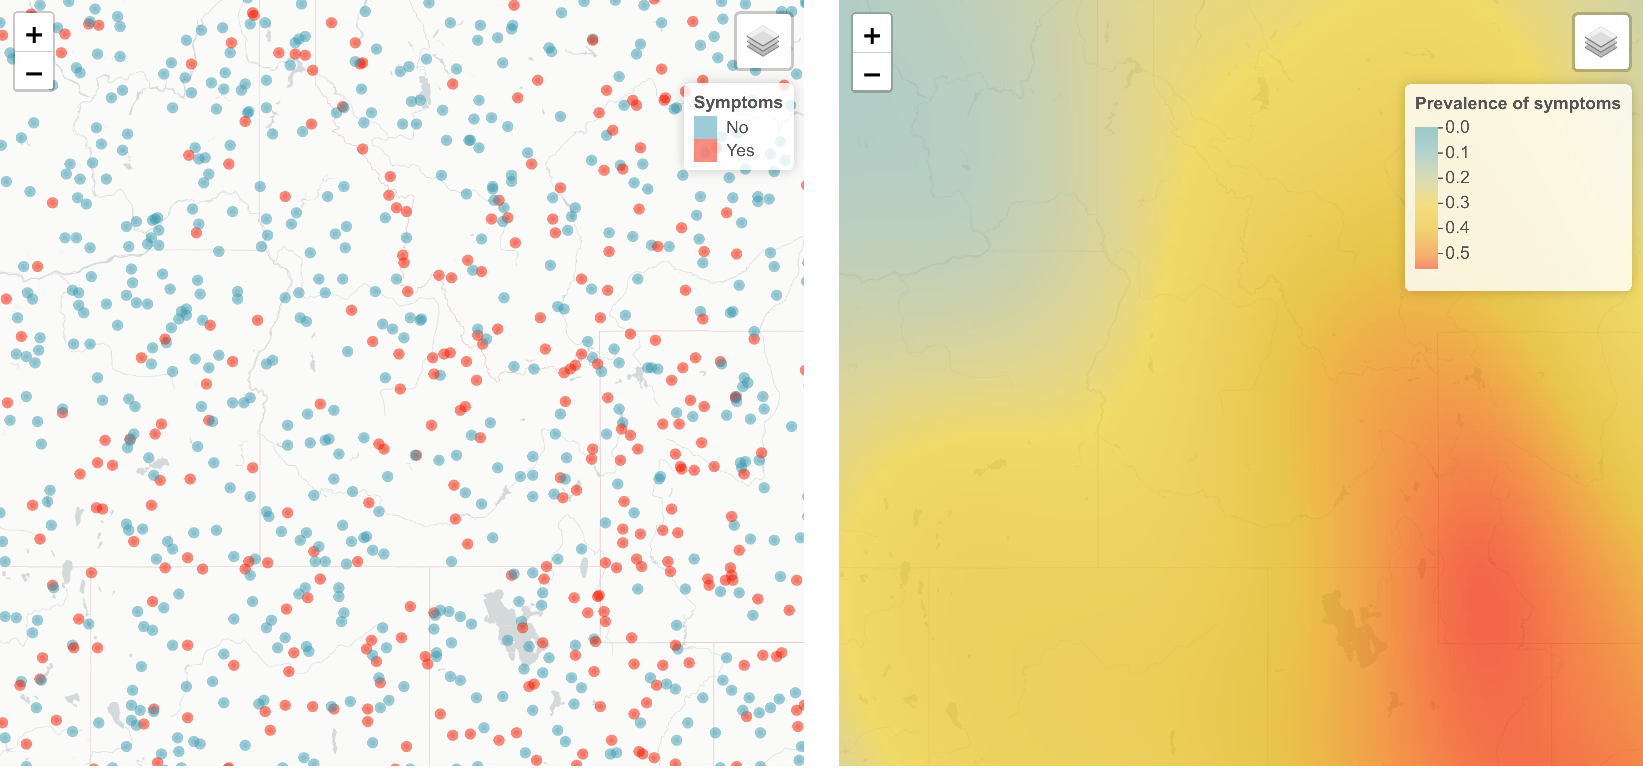
# Our approach
Using our geospatial spatial prediction algorithm, it is possible to identify the underlying characteristics at the location of every observation we think are related to covid-19, including population density and proportion of the population over 70. Using statistical models, the algorithm then establishes the relationship between these predictors and the probability of having symptoms. Once we know this relationship, we can predict this probability throughout the country using the values of the predictors in any location.
# Minimum required input
Set of coordinates of responses, with number sampled and number with symptoms.
lat | lng | n_positive | n_trials |
|---|---|---|---|
| 1.1 | 1.1 | 0 | 1 |
| 1.2 | 1.2 | 2 | 3 |
| ... | ... | ... | ... |
# Implementations
We are currently supporting a UCSF led project collecting information from volunteers on symptoms around the world.
Think this sounds useful?
You can reach us at hello@locational.io to ask any questions, request additions or changes, or arrange a demo. We are actively developing these algorithms and would like to hear from you.